Proudly Serving 25+ Brands
Building Scalable Digital, Marketing & Sports Solutions for Global Businesses
Togwe is a global AI-powered services company delivering gaming platform development, performance marketing, digital growth, operations, and sports-focused solutions.
We help businesses launch, scale, and optimize high-performance platforms with measurable results.
Get a Free Consultation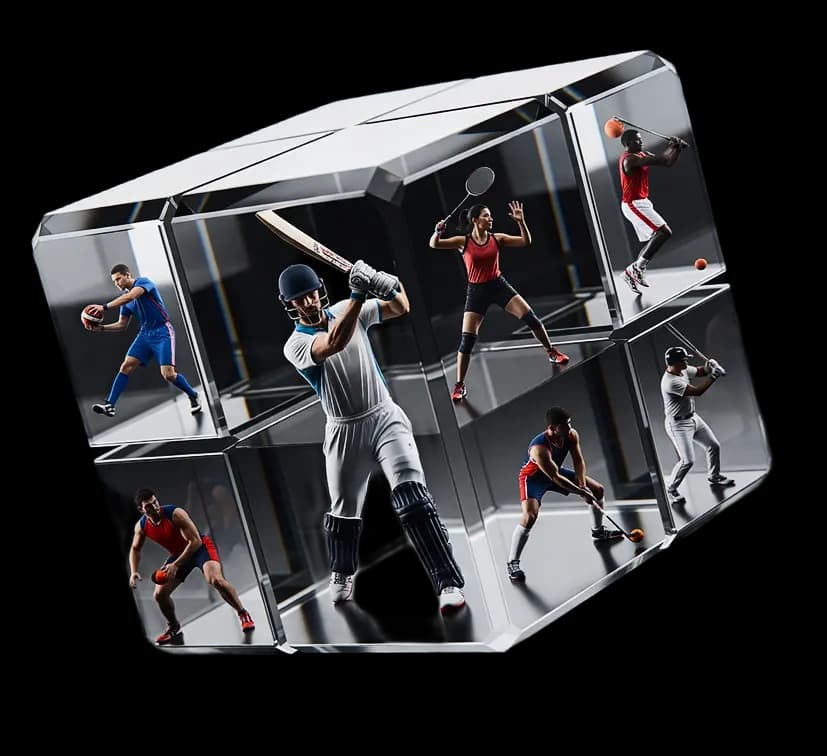
AI-driven solutions powering gaming,sports,and digital growth at scale.
We build AI-powered systems that drive real performance across gaming, sports, and digital platforms. From smarter engagement to scalable growth, our solutions are engineered for speed, accuracy, and impact.
Explore our Services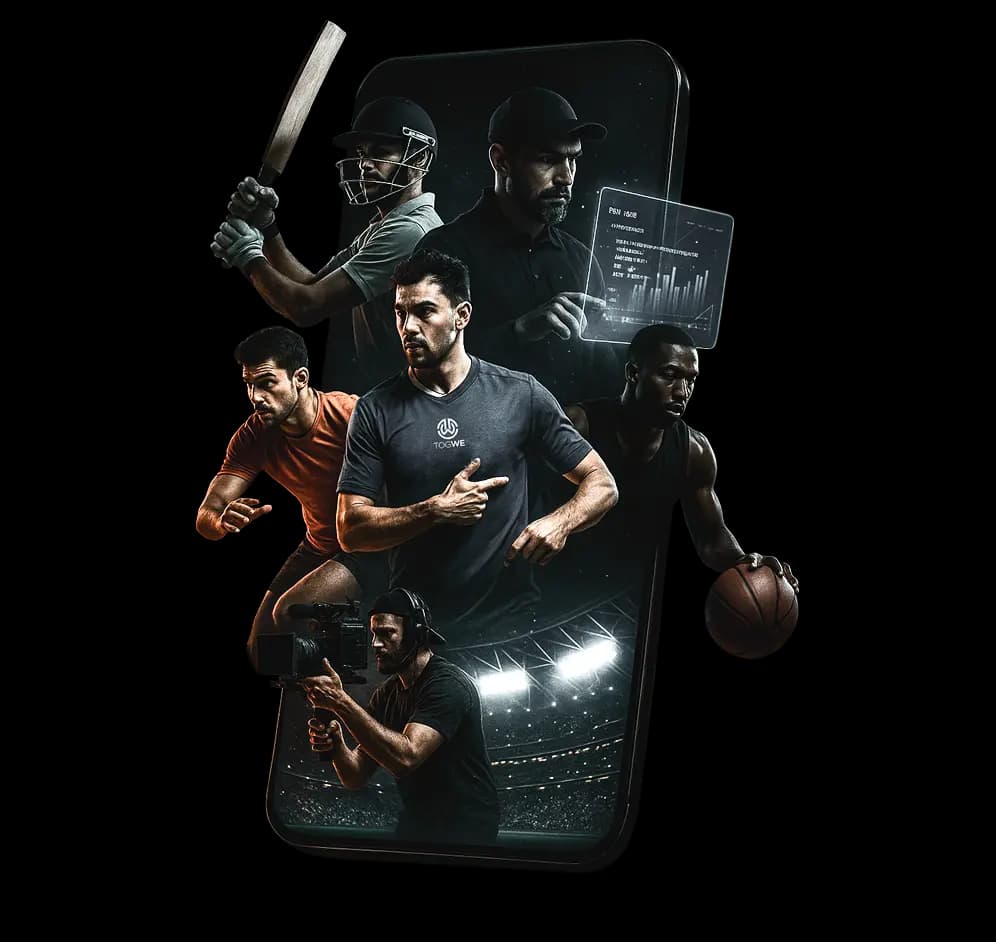
Sports App Development
Secure, scalable platforms built for performance and growth.
Digital Marketing
Intelligent user acquisition, optimization, and revenue growth.

Content Creation
Data-informed content that drives engagement and brand recall.

Customer Support
AI-assisted support workflows for faster resolution and retention.

Branding & Advertising
Insight-led branding and measurable advertising outcomes.
Sports Sponsorship Management
Data-backed sponsorships and long-term partnerships.

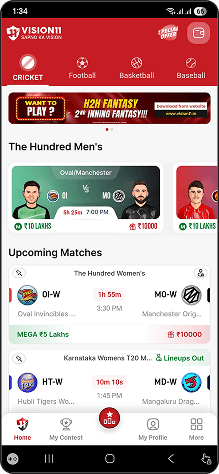
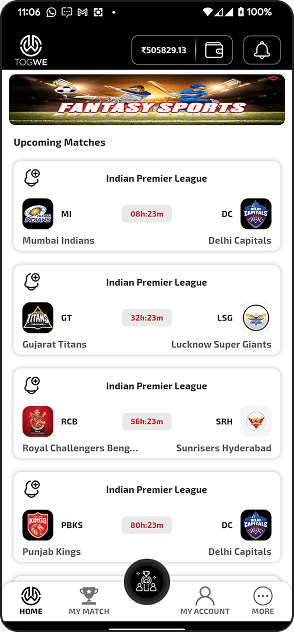
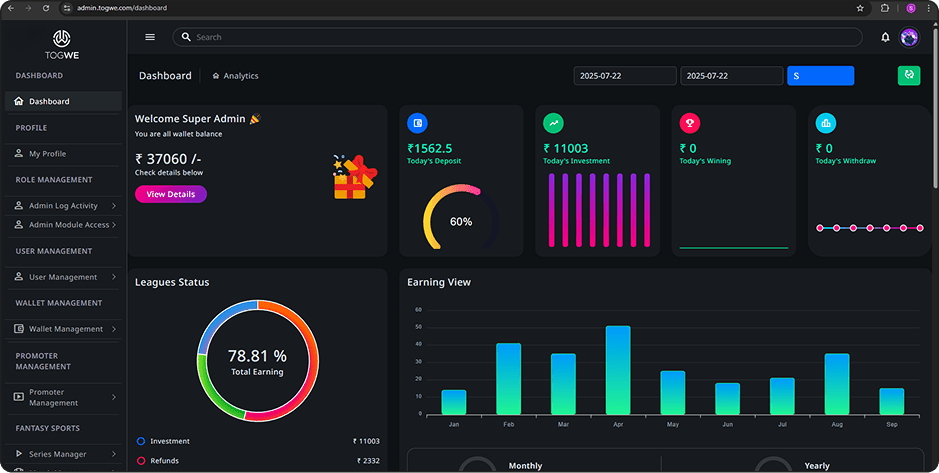
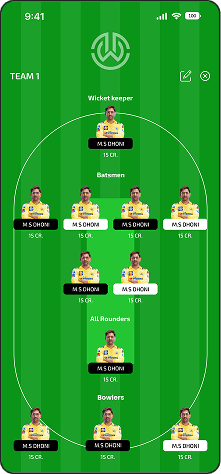
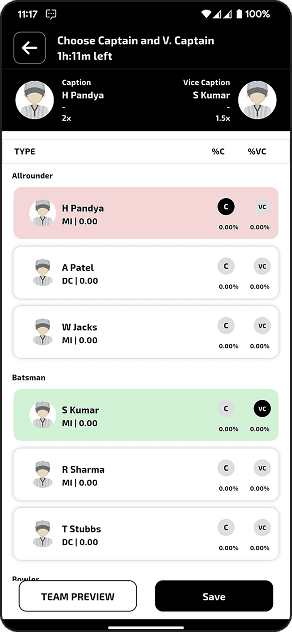
Glimpse of Mobile & Web Apps
A Glimpse of Your Next
Sport Platforms in Action
Take a tour through our sports app’s interface and see how every screen is thoughtfully designed for performance, clarity, and user satisfaction.
Who we are?

Togwe is a global services company operating at the intersection of gaming, technology, marketing, operations, and sports. We partner with platforms, organizations, and enterprises to deliver practical, scalable, and performance-focused solutions that support long-term growth.
We don’t offer generic services — we build systems, execution models, and partnerships that scale.
Our Values
Transparency
Clear communication, honest execution, and measurable outcomes
Performance
Every solution is designed to drive efficiency, growth, or engagement
Accountability
Ownership of execution, delivery, and results
Long-Term Growth
We focus on sustainable partnerships, not short-term wins
Growth
0%
Established
0
Successful Projects
0+
Users Impacted
0M+
Who We Work With
We partner with organizations that value performance, scalability, and long-term growth.
- Established businesses and enterprise teams
- High-growth companies scaling globally
- Sports organizations and ecosystem partners
- Digital-first brands with complex operations
- Innovation-led companies seeking measurable results
Our clients

Agile. Transparent. Built to Scale.
We follow an Agile-driven development and growth model designed for gaming platforms, where speed, performance, and continuous improvement are critical.
1. Discovery &
Strategy
2. Product &
Experience Design
3. Agile Development
(Sprint-Based)
4. Testing, Security &
Performance
5. Launch & Growth
Enablement
6. Scale, Optimize &
Evolve
Our Case Study
We aren’t just all talk company—rather we are go and build it experts. Take a look at our portfolio of successful projects.
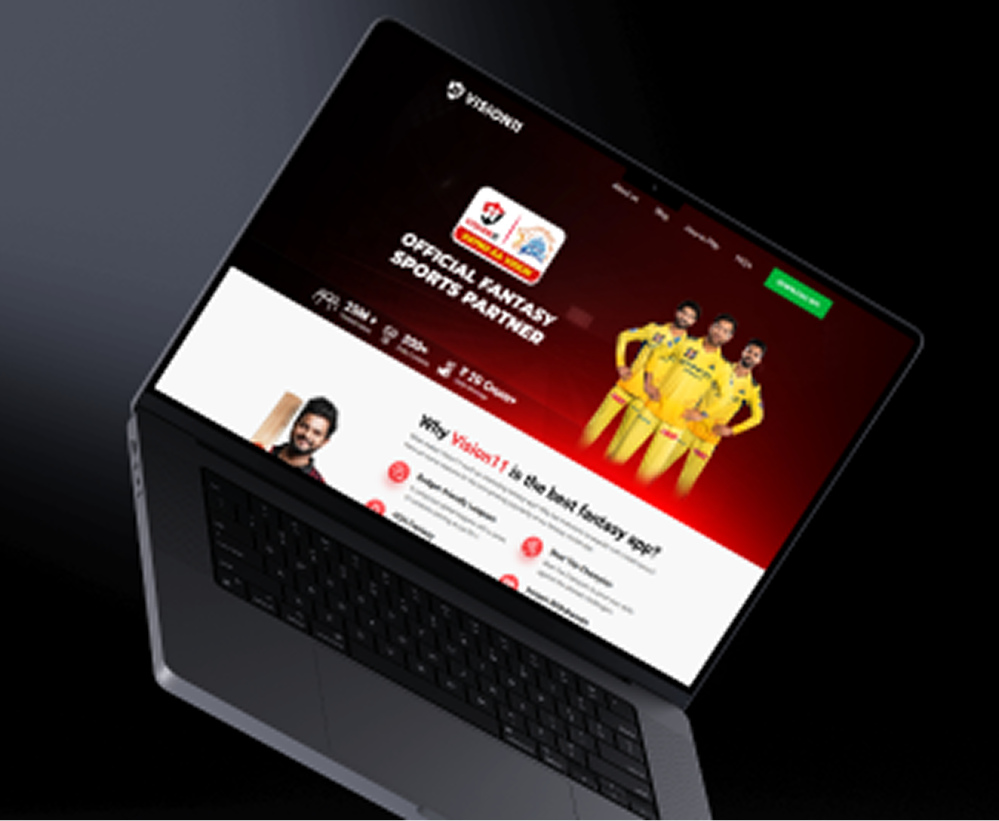
Fantasy Sports Application
VISION11
One of the leading fantasy sports platform, vision11 acquired a user base of 20M+ users in just 5+ years by encouraging them with multiple giveaways, high winnings and multi-sports availability.
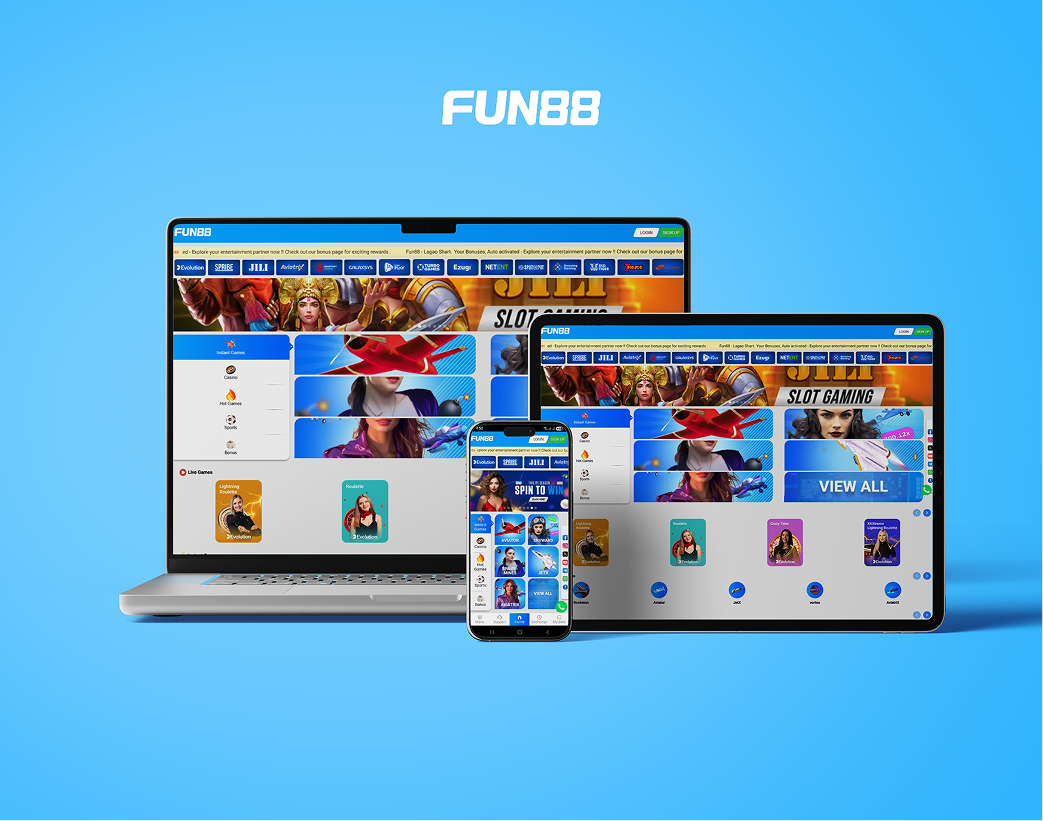
Betting platform
Fun88
One of India’s fastest-growing Sport Betting platforms, Fun88, turned to Togwe for Betting sports app development and go-to-market support.
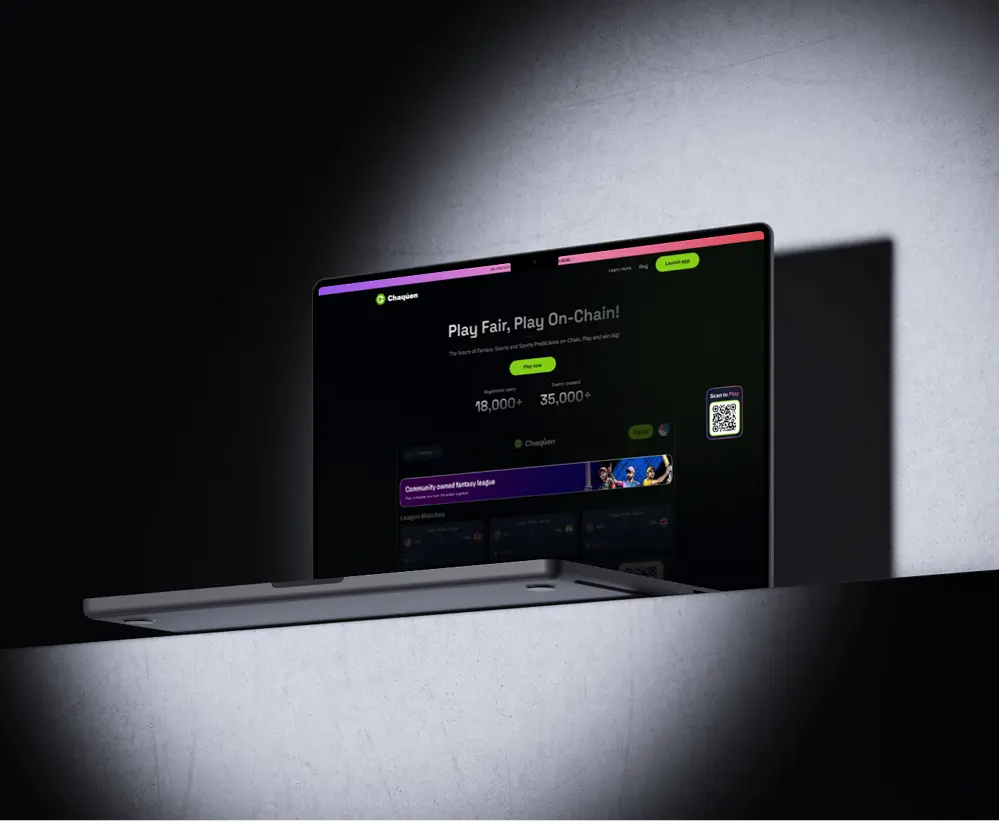
Fantasy Sports Application
Chaquen
One of India’s fastest-growing Fantasy platforms, Chequen, turned to Togwe for Fantasy sports app development and go-to-market support.
Togwe has been recognized for delivering top-quality IT solutions and marketing services to businesses across the globe.


Take a look at what our past clients say about our mobile app development and other services.
Frequently Asked Questions
Insights That Power Growth
Explore articles on gaming platforms, AI-powered technology, digital natives, and performance marketing - designed to help you get ahead in the fast-paced digital design world.
![List of Brands Endorsed By Paul Pogba [2026 Updated]](https://www.togwe.com/backend/wp-content/uploads/2026/03/brands-endorsed-by-paul-pogba.webp)
List of Brands Endorsed By Paul Pogba [2026 Updated]
Napol Pogba wherever the game or camera appears. He is given an answer, which imprints itself on you and then takes it forward. 2026 The qualities that eat the name of your party name ensure together with his life group: the same, the game, the concern and the enthusiasm that comes out. It […]

List of Brands Endorsed by LeBron James (2026 Updated)
LeBron James walks the world like a man who has learned to lift weights. He has been the face of basketball for two decades, and he has turned that face into a portfolio of deals and partnerships. His endorsements by 2026 read like a map of modern commerce: shoes and watches, drinks and […]
![List of Brands Endorsed By Cristiano Ronaldo [2026 Updated]](https://www.togwe.com/backend/wp-content/uploads/2026/03/brands-endorsed-by-cristiano-ronaldo.webp)
List of Brands Endorsed By Cristiano Ronaldo [2026 Updated]
Cristiano Ronaldo has built a career defined by discipline and relentless hard work. By 2026, his name will be on a long list of brands. They are shoes and watches, drinks and phones, toys and equipment. He gives them his image and he gives them his reach. Not all deals are created equal. […]